
Latency and battery: averages versus tails
mean total 1.8844 s, but 21/50 trials over 2 s
keep the tail, not just the average. battery trace gets to ~18 min continuous use... need duty-cycle notes next to that
- The latency sheet separates logic, mechanical and total response time across 50 rows. Recomputing from those rows gives mean logic 1.4834 s, mean mechanical 0.4010 s and mean total 1.8844 s. Total response spans 1.19–2.61 s, and 21 of 50 totals exceed 2 s. Therefore “average below two seconds” and “every trial below two seconds” are different tests; keep the requirement tied to whichever was actually intended.
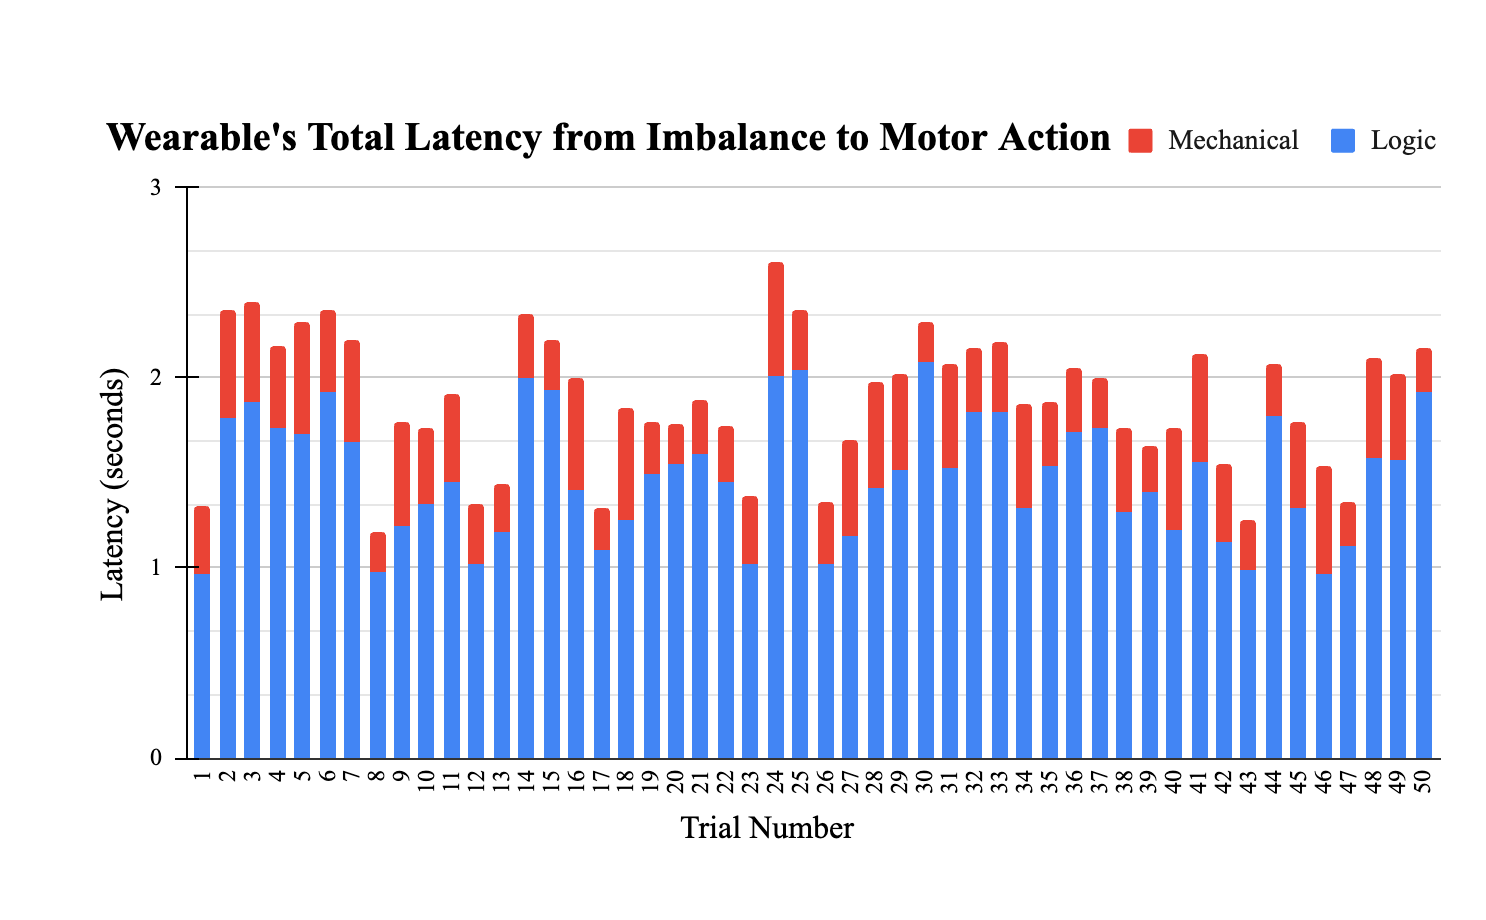
Logic and mechanical latency across 50 trials.
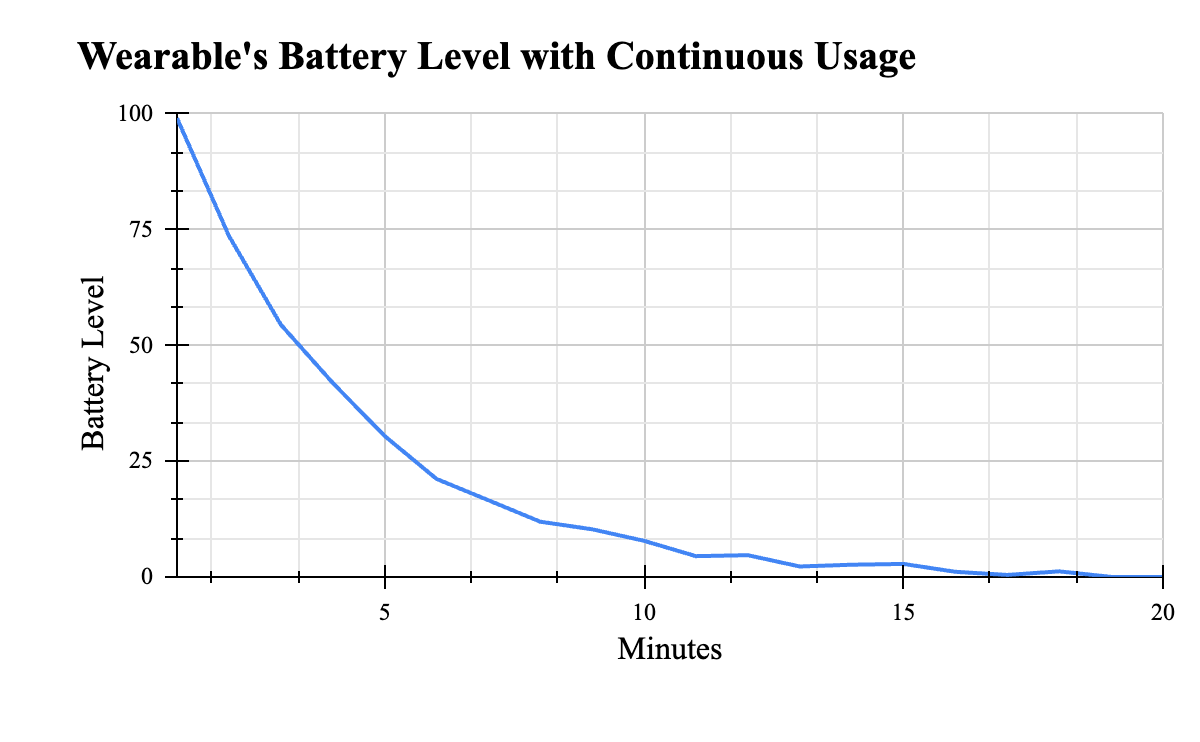
Battery level during continuous use.
- Battery readings descend from 99.03 at minute 1 to 30.43 at minute 5, 7.79 at minute 10 and 1.2 at minute 18; minutes 19–20 are zero. These support the poster's approximately 18-minute continuous-use statement, not an all-day battery estimate. Small increases near the low end are present in the recorded readings; the sheet alone does not identify their cause.
- For the next measurement pass, preserve clock/timestamp source, phone and Bluetooth conditions, model version, motor angle/load, battery voltage/current and the definition of the percentage reading. Report a percentile or maximum beside the mean, and separate continuous motor testing from an intermittent-use duty cycle.
battery_latency.pdfduplicates this dataset and is a convenient static reference, not a second independent experiment.