ReconBench: guide-tree construction and annealing
tree generation + annealing toward Colless / gamma targets. Need to see how far annealing moves things away from the original birth–death samples. Side rabbit hole: how many completely different trees share those same 2 stats?
tree_gen_bd.py: simulate a birth–death tree with constant, exponential or linear birth/death-rate functions. The nine combinations are selected from fitted regimes. Sample crown age, taxon count and rate/time coefficients, then retain viable realizations.
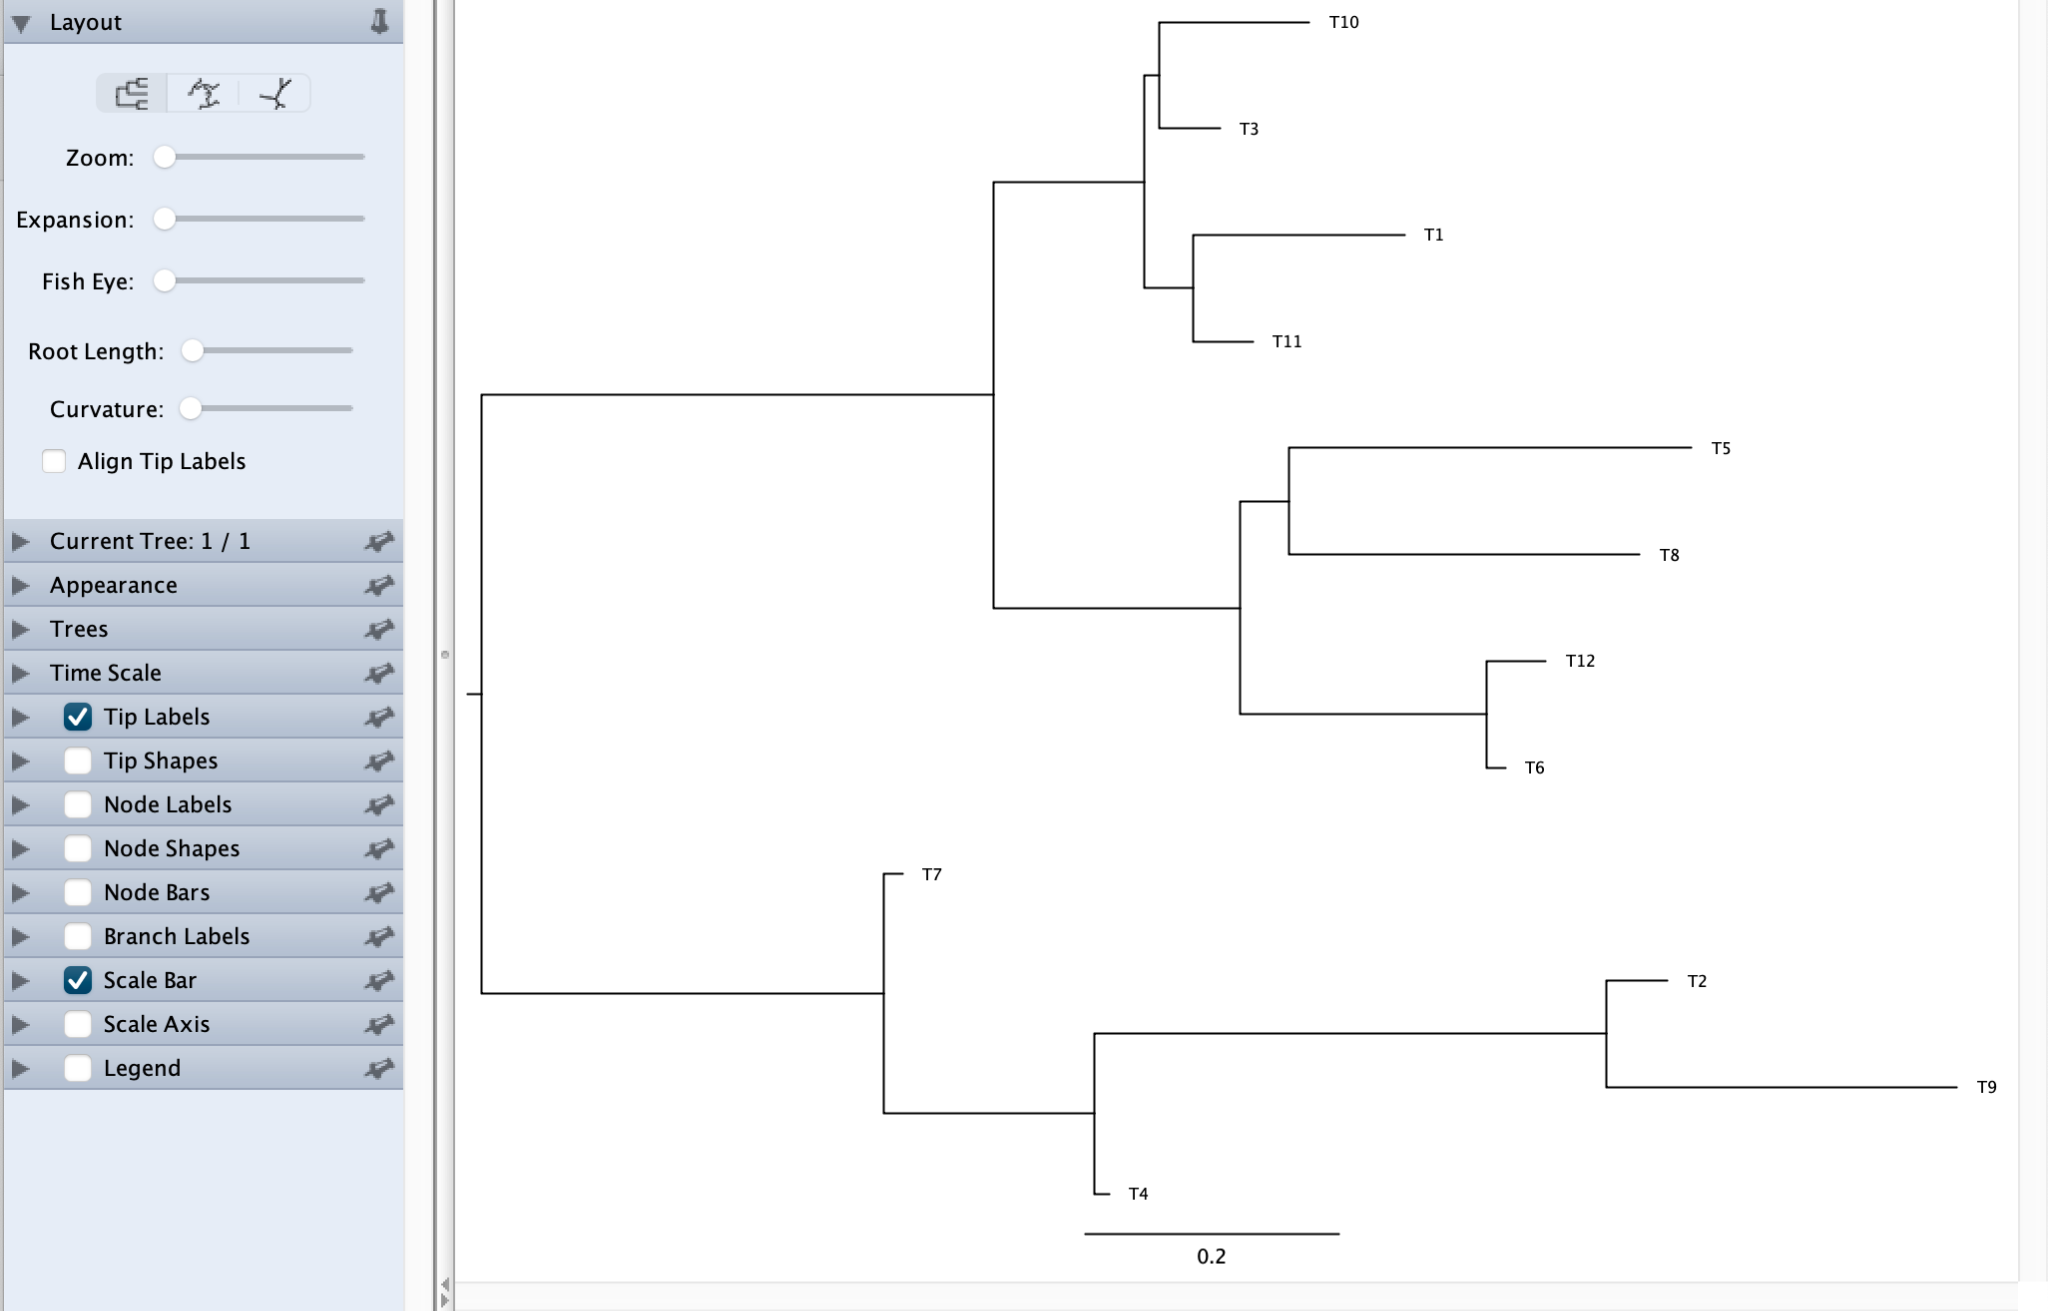
Generated SCOP Type 1 guide tree in FigTree.
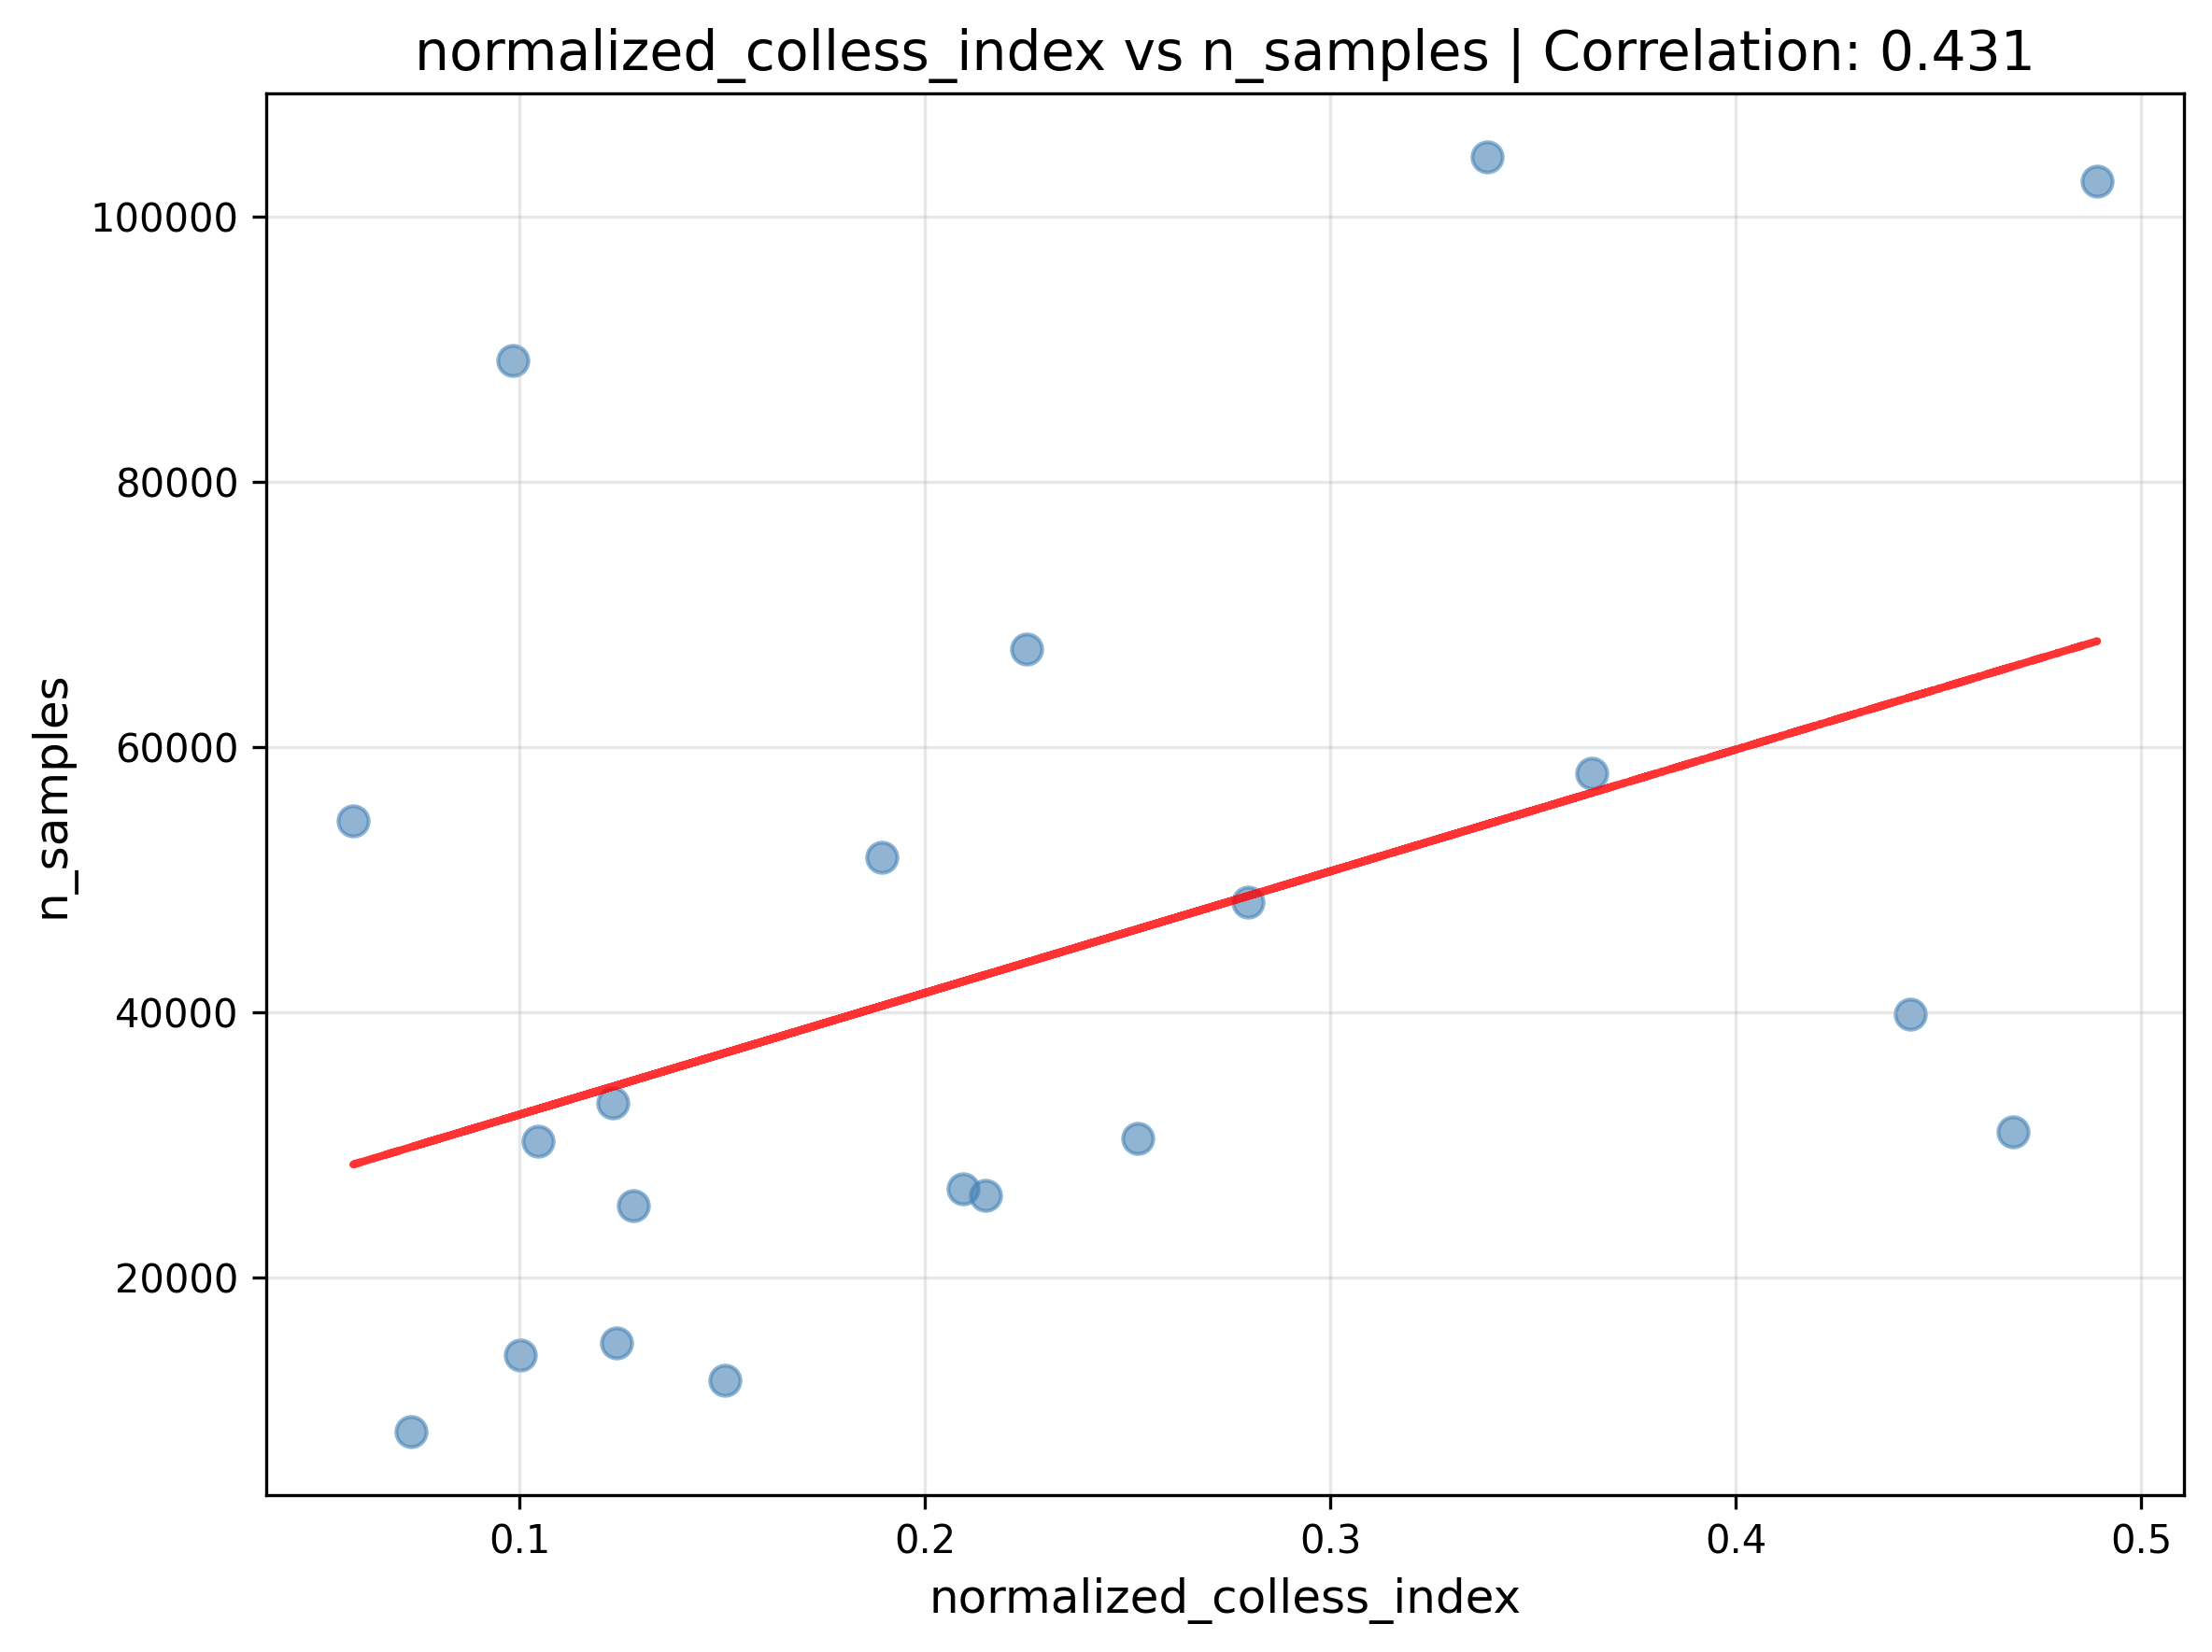
Historian: normalized colless index versus n samples.
target statistics: normalized Colless imbalance and Pybus–Harvey gamma. Compare generated and target vectors using the report's Euclidean-distance objective. NNI and SPR proposals alter the candidate tree; preserve temporal consistency when reassigning node ages.
- recorded acceptance sketch: accept an improved distance; otherwise accept with
exp(-delta / temperature). Lower temperature geometrically and retain the best encountered tree. Export Newick plus achieved statistics and the optimization trajectory.
- review questions: are the two target statistics on comparable scales, and how much does the annealing procedure alter the original birth–death distribution? A tree that matches two summaries is not guaranteed to reproduce every biological tree property. Preserve both the initial simulated tree and optimized tree when auditing this effect.
- The report describes this as the final method after earlier consensus/RF-based approaches, not as a single unchanged procedure throughout the summer.
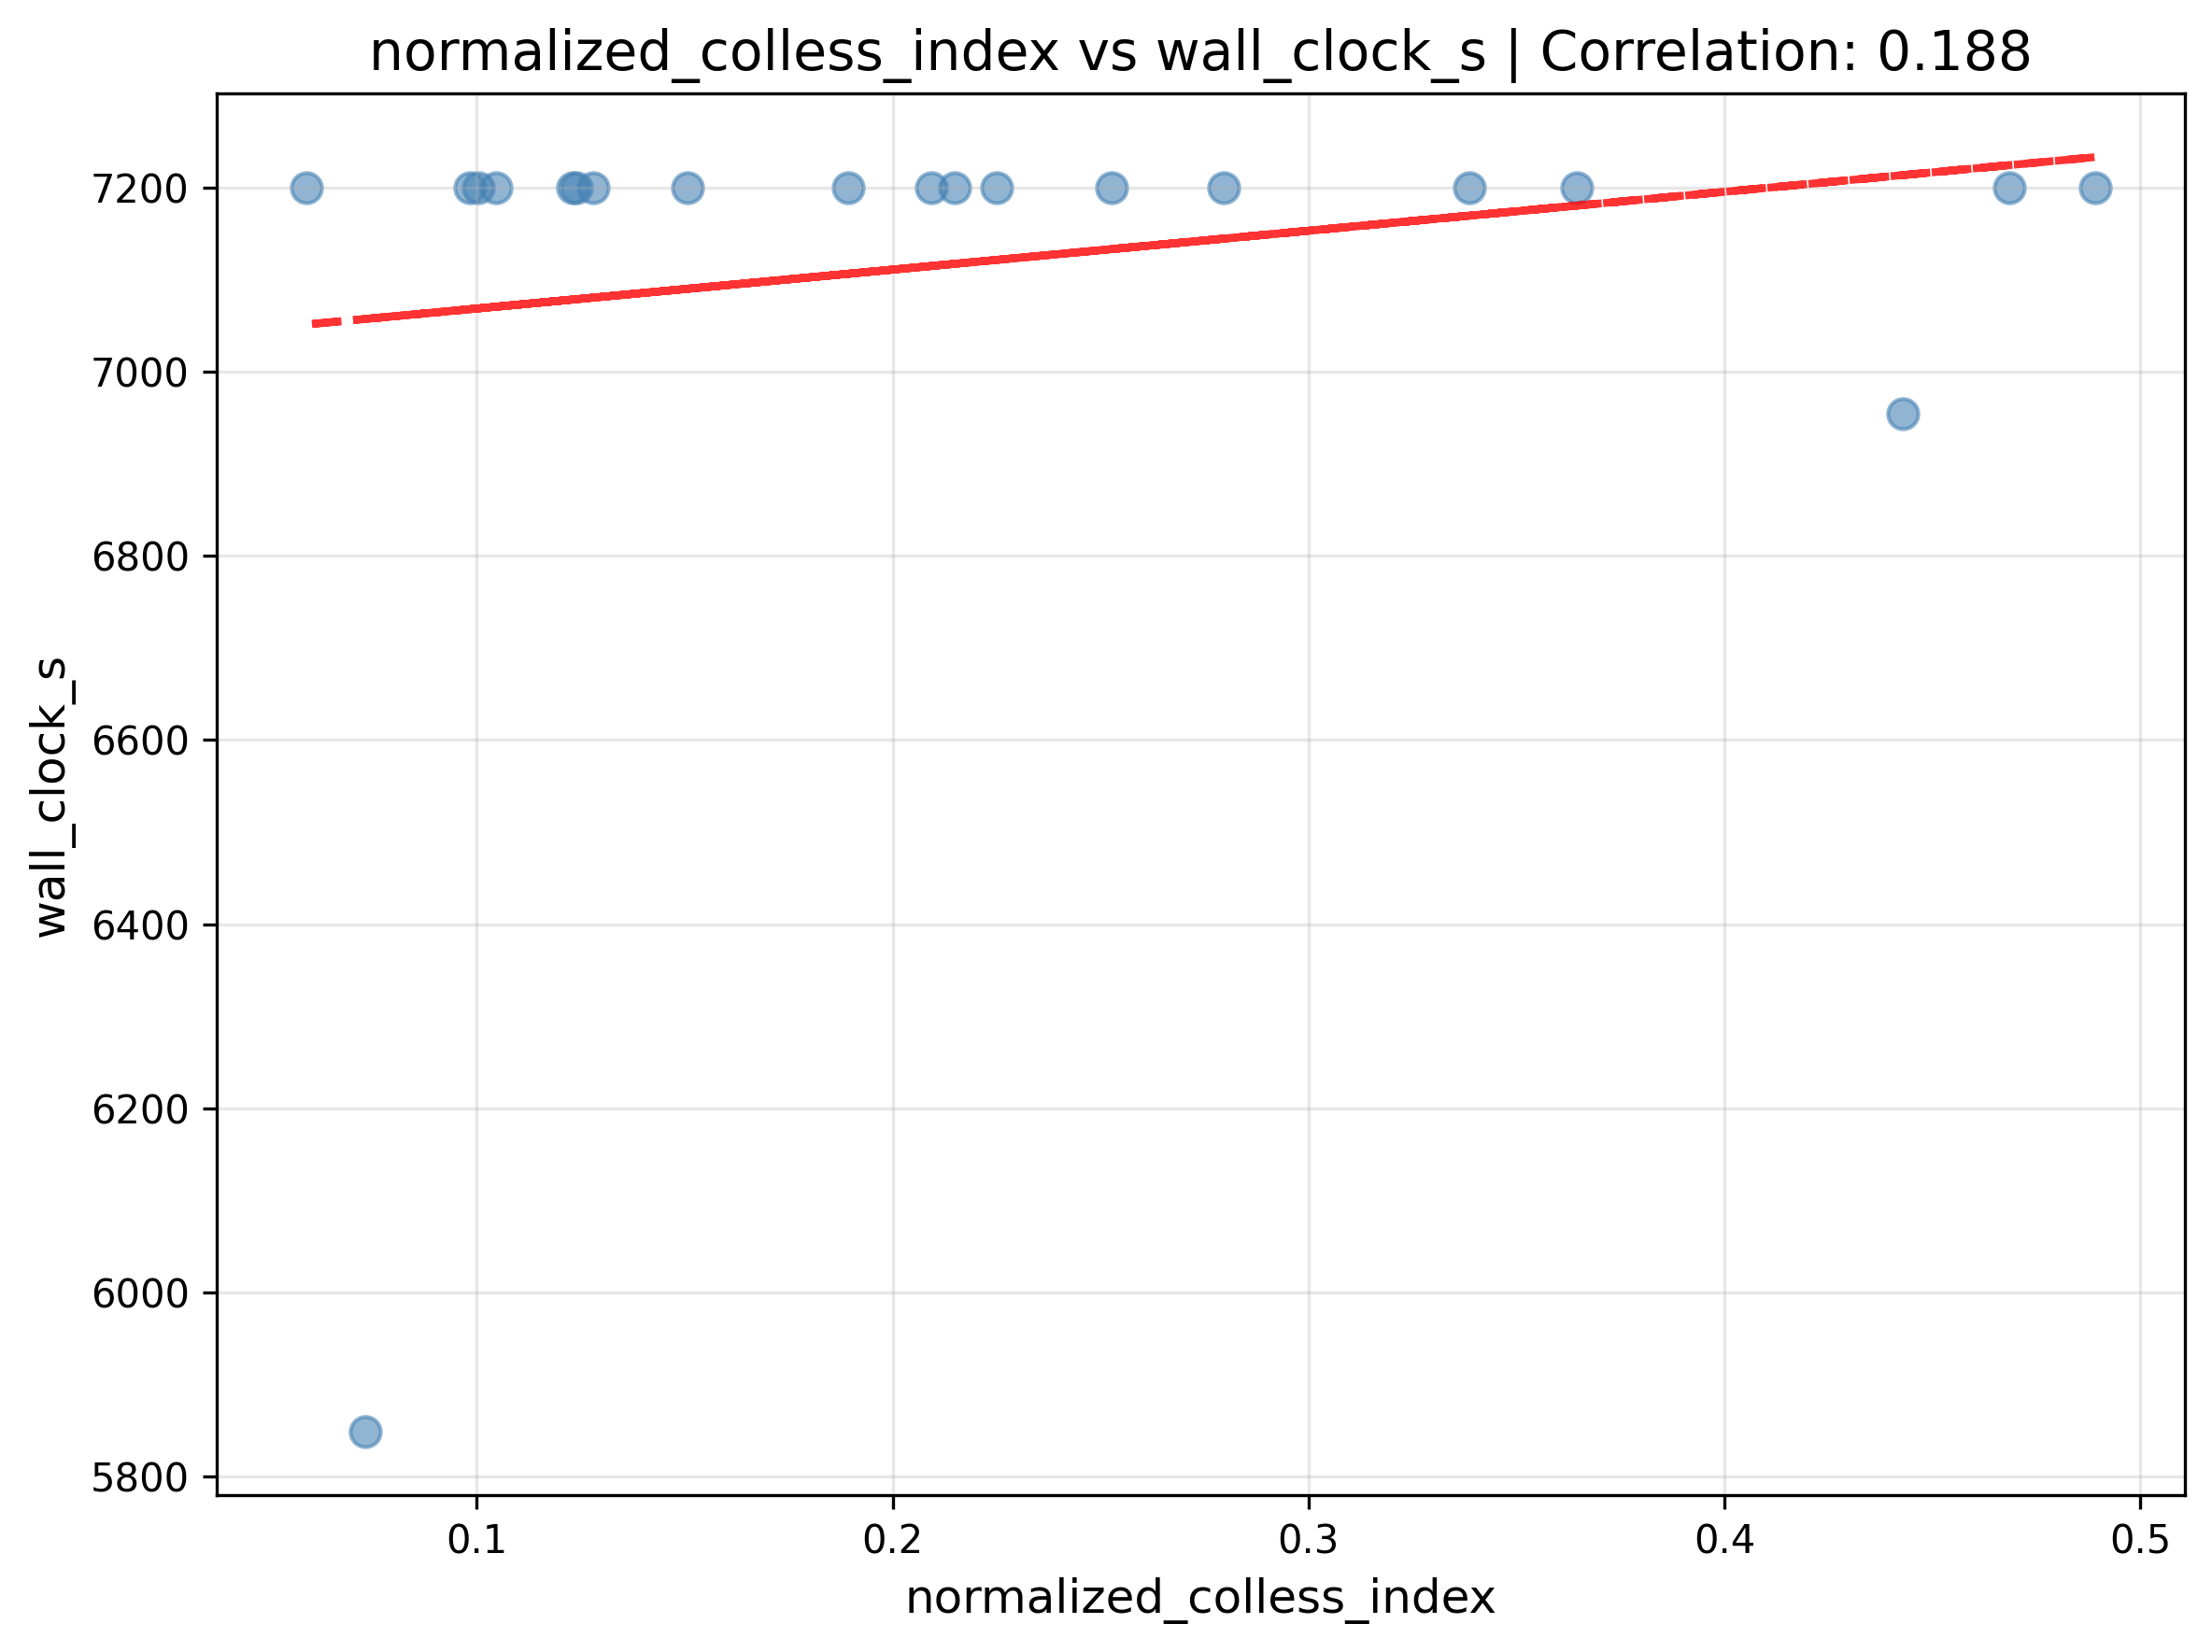
Historian: normalized colless index versus wall clock s.
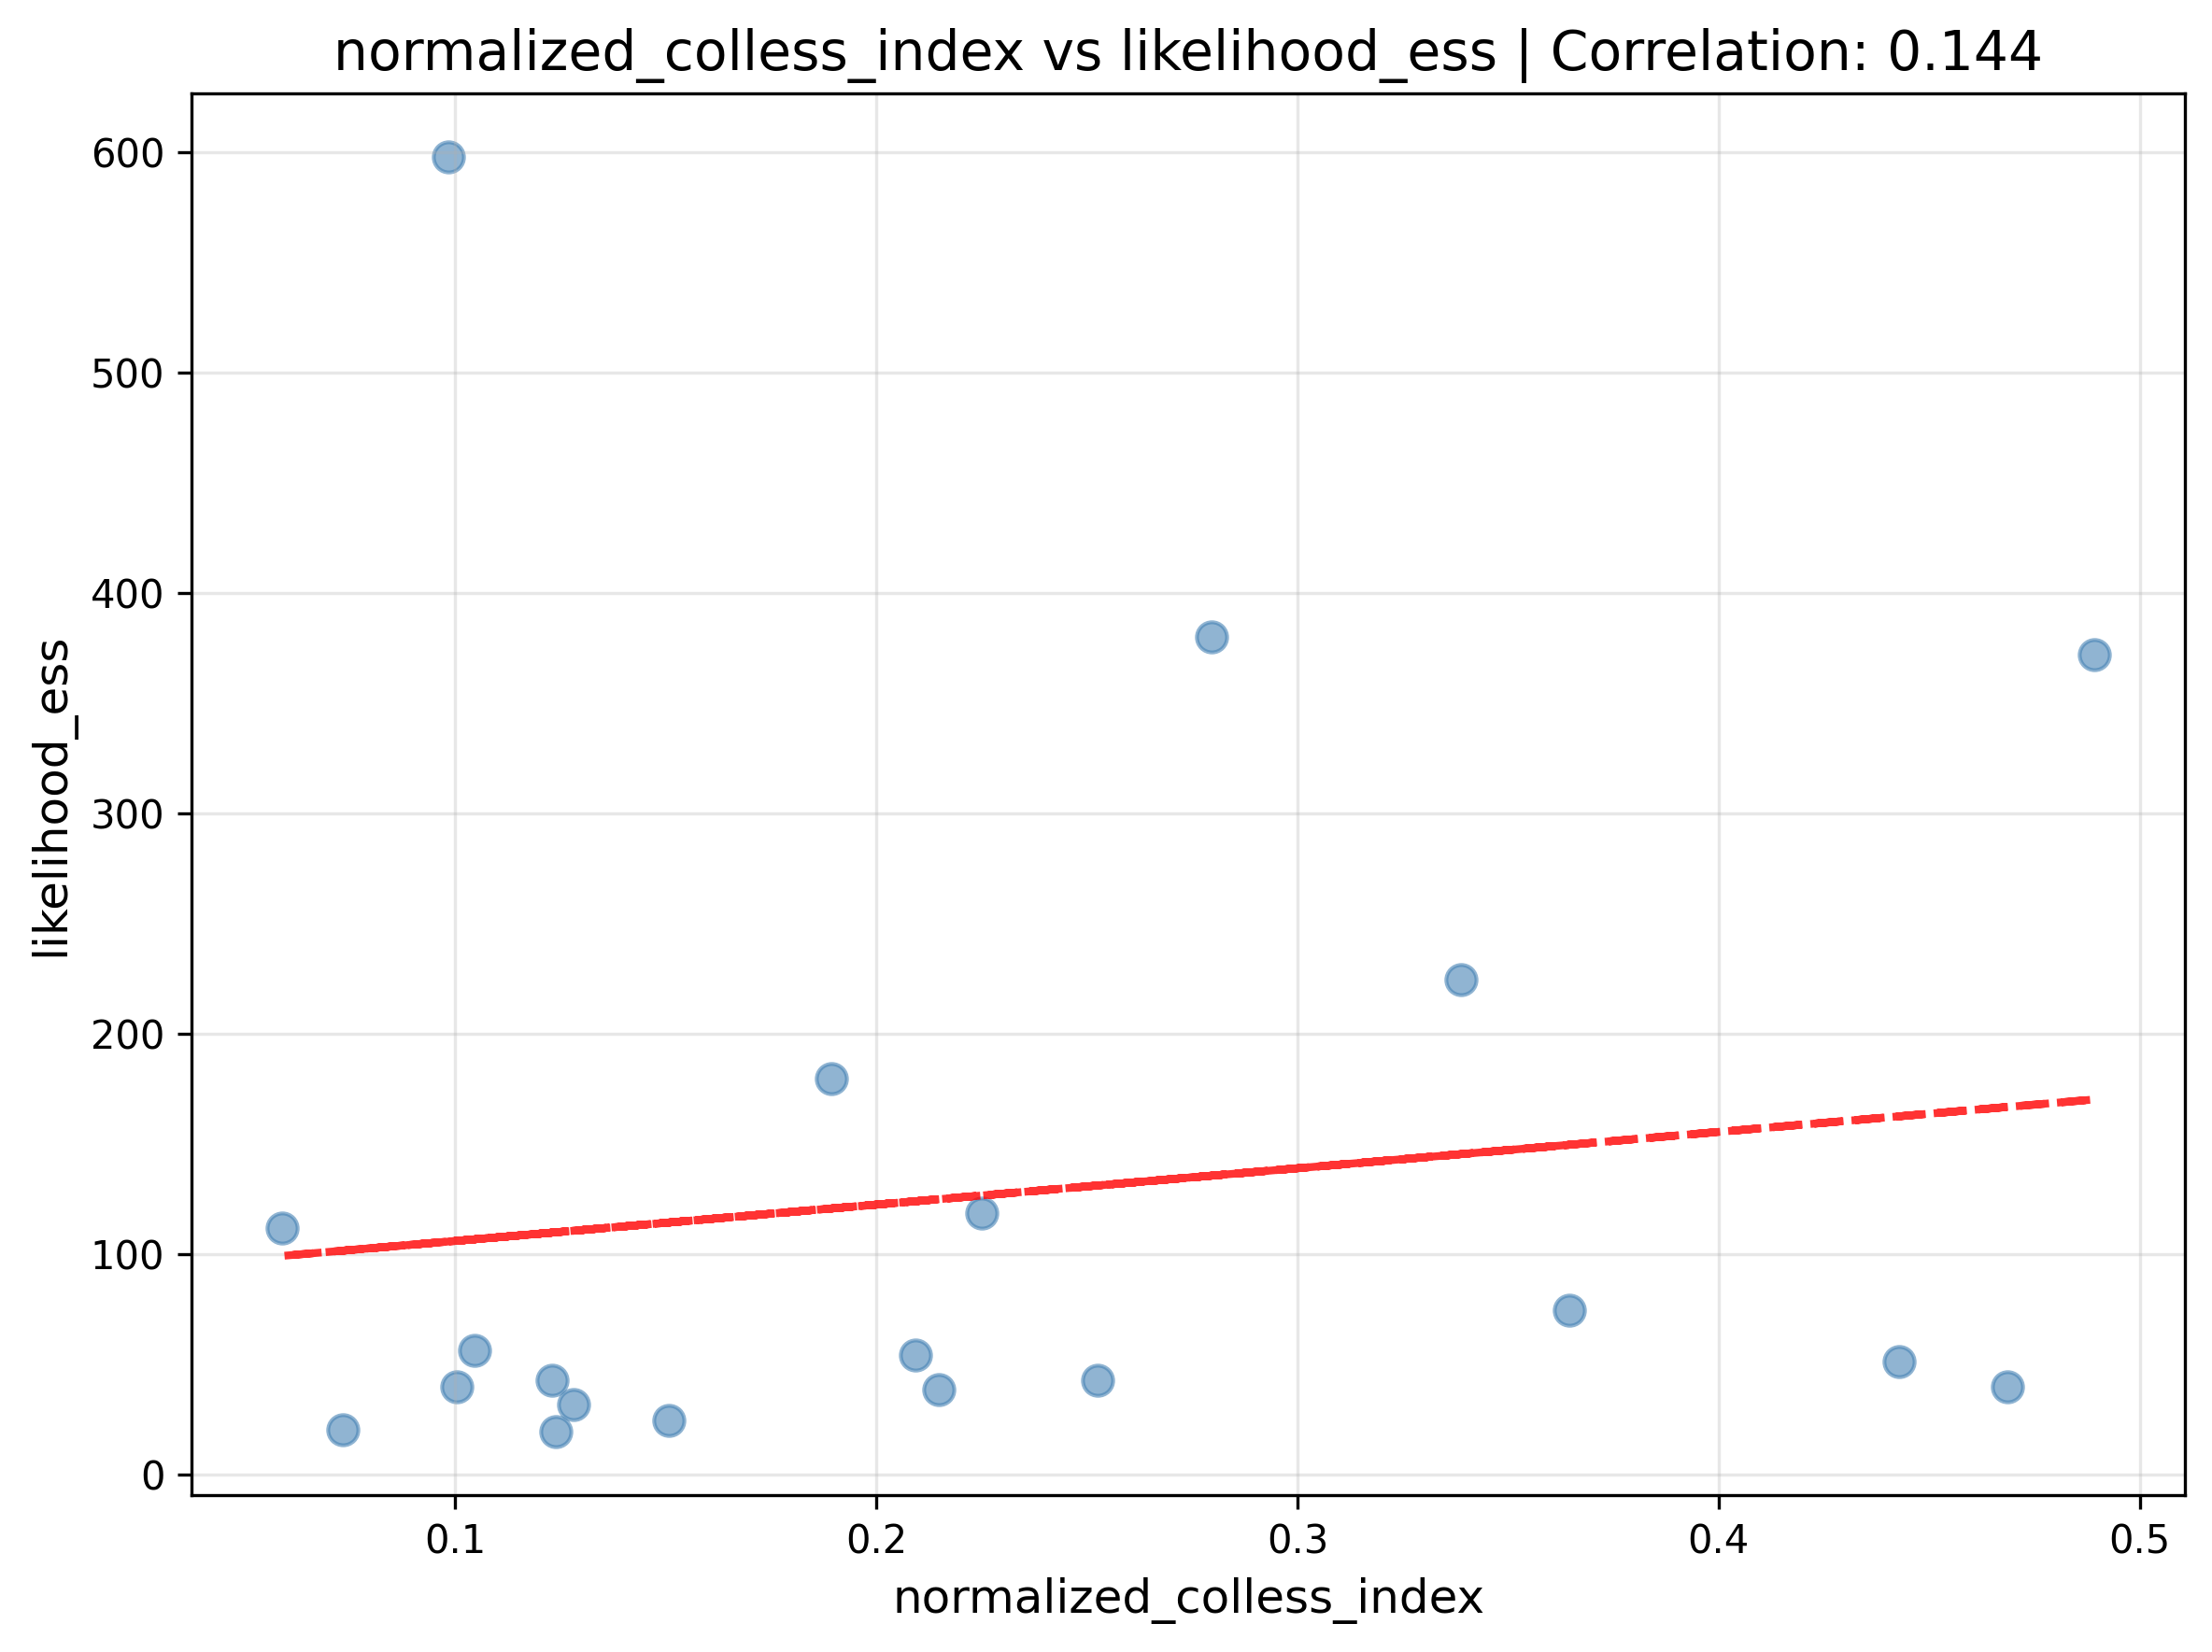
Historian: normalized colless index versus likelihood ess.