THALis: live EEG visualization modules
RMS / traces / topomap / quality display — different things, don't read them as interchangeable. deliberately awful synthetic input might be a good way to test whether these views actually help
- archived modules (adba8f3):
console.pyorchestrates the display;heatmap.pyshows RMS amplitude;quality.pyholds quality indicators;time_series.pydisplays raw/filtered channels;topomap.pymaps band-power values onto a scalp layout.
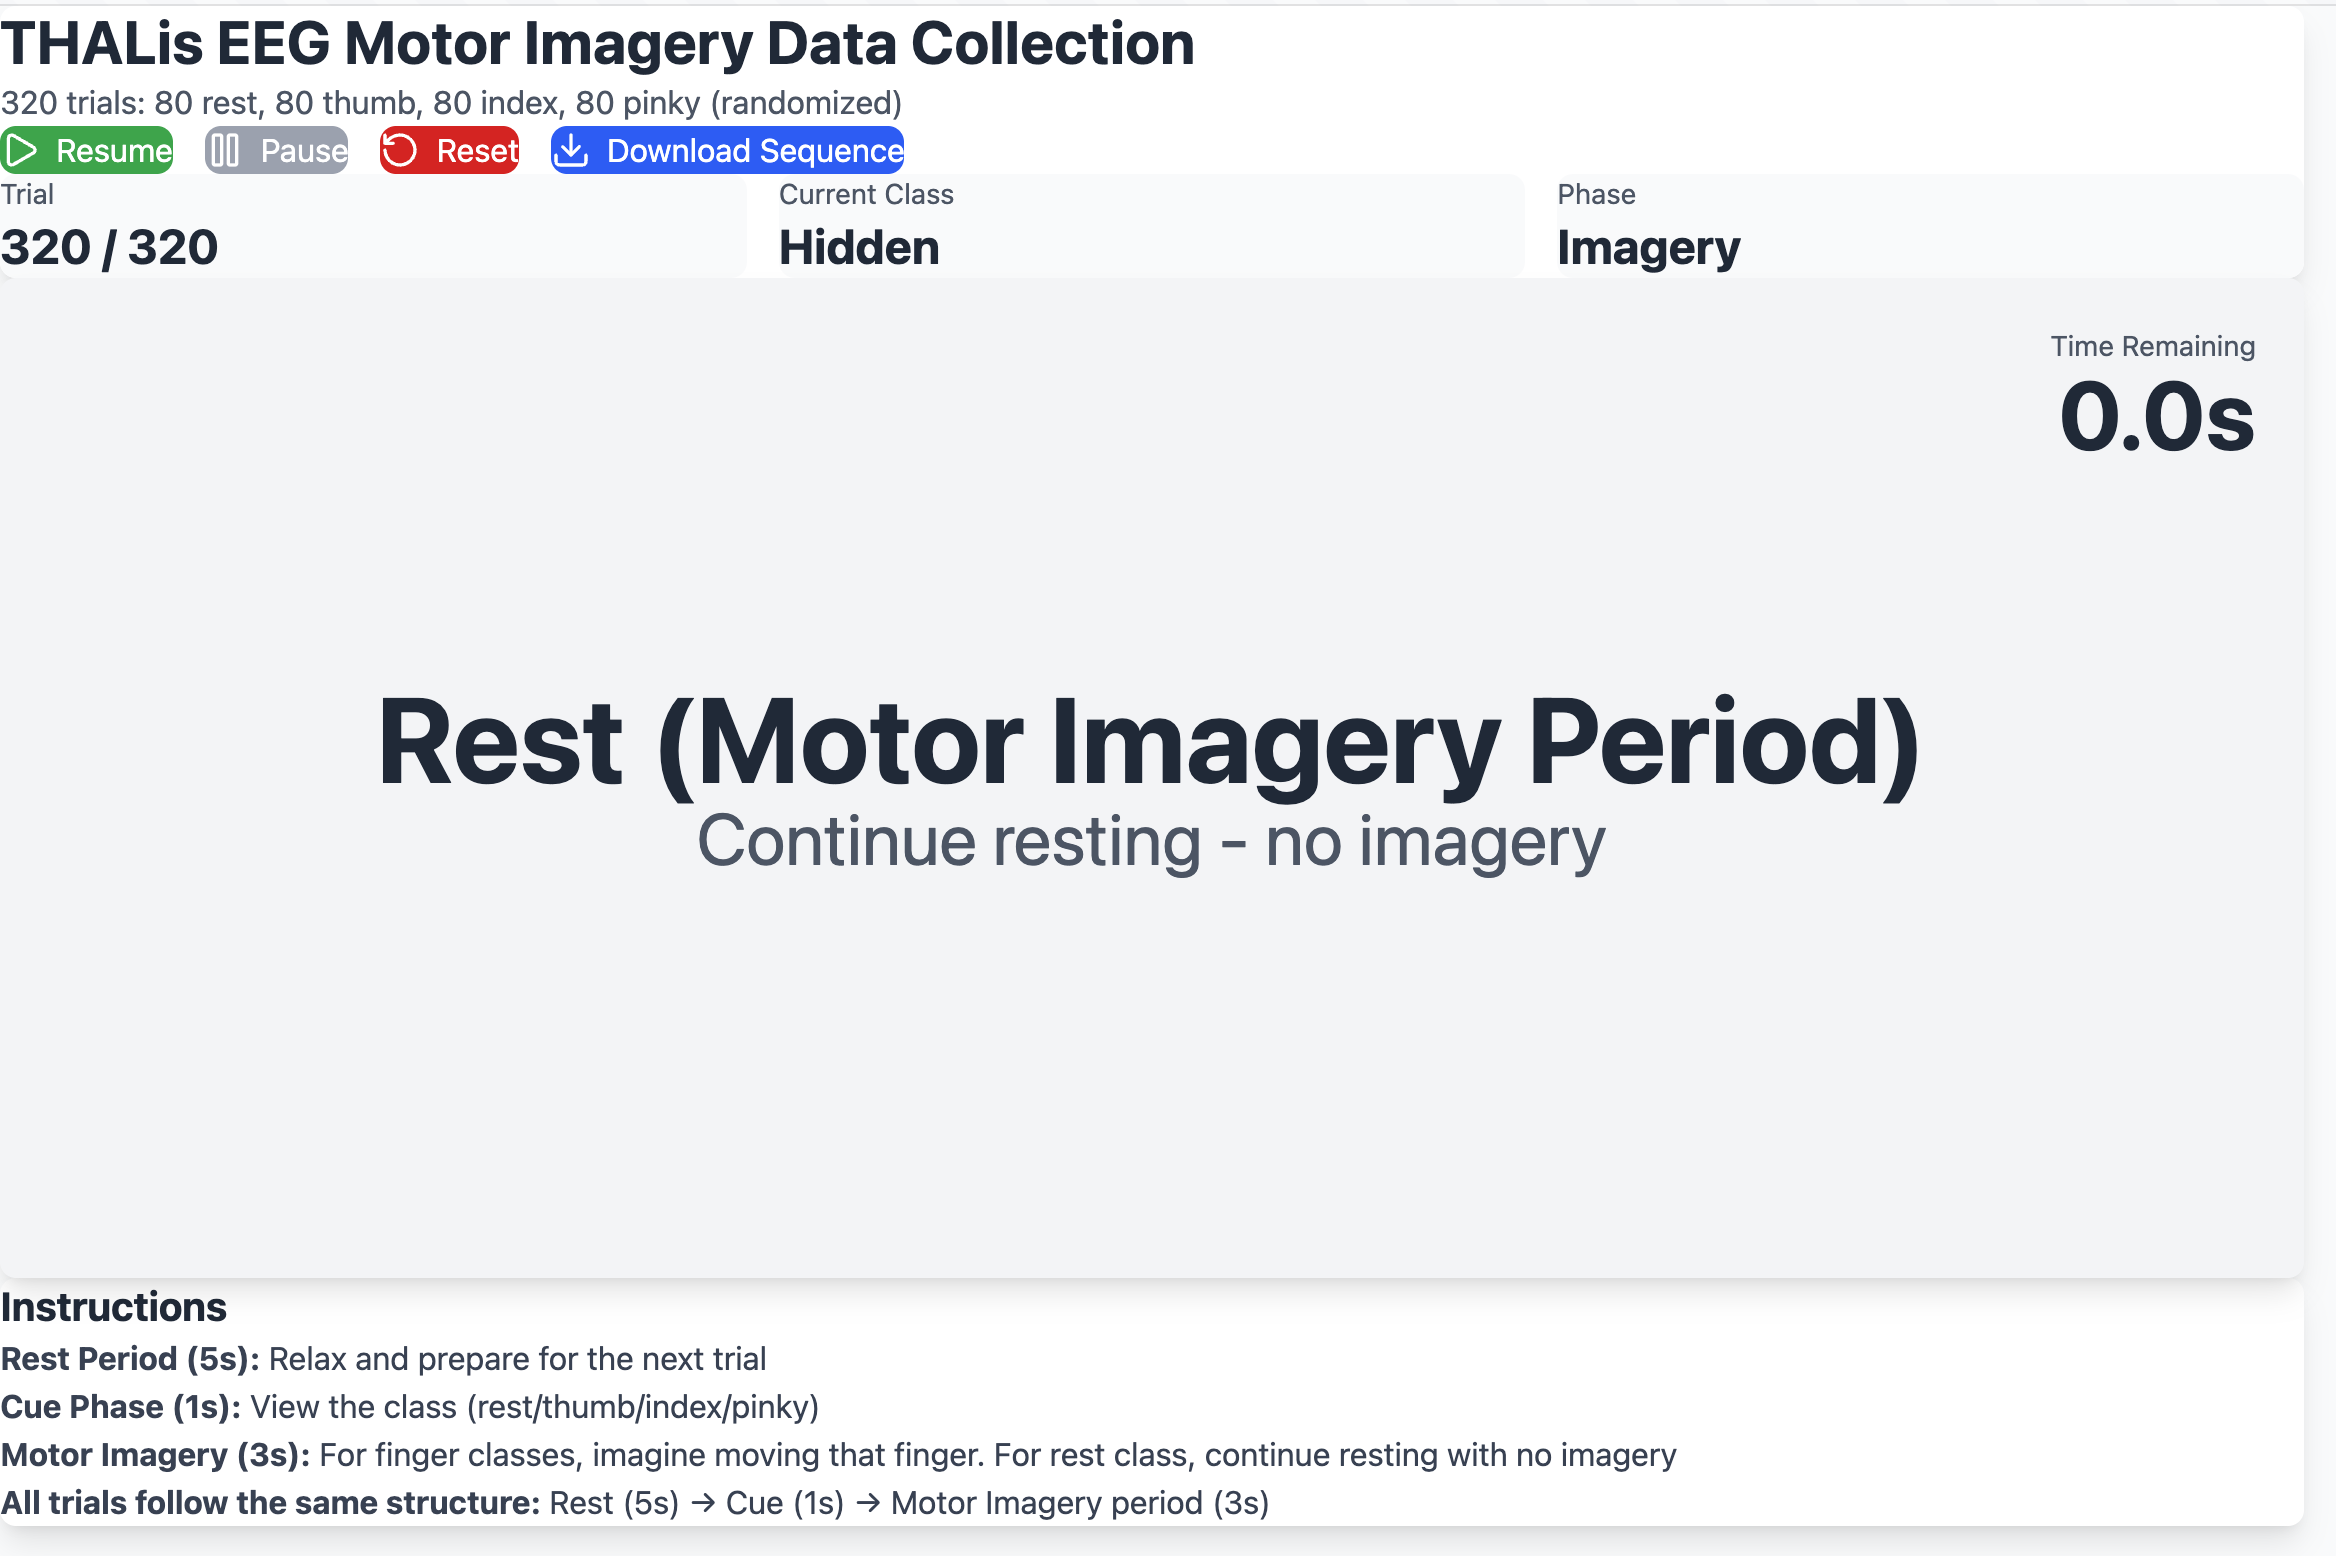
Motor-imagery cue timing
- reference location: the visualization utility directory, ultimately
src/tools/visualization/. Streaming callbacks were extended to supply display data. The commit also preserves error screenshots and another development run.
- review questions: what window and units drive RMS/band-power values? Are “quality” indicators directly measured quantities or derived heuristics? In particular, do not assume an impedance value is a hardware measurement merely because the archive lists impedance among quality concepts.
- debug use: compare the raw and filtered trace, verify channel names against the cap montage, then inspect aggregate views. A scalp interpolation can look smooth even with a mislabeled channel. Preserve display scaling and filter settings with screenshots used as evidence.
- archived code references:
adba8f3.